Institutional Insights: Goldman Sachs 'Gold - China Buying The Dip'

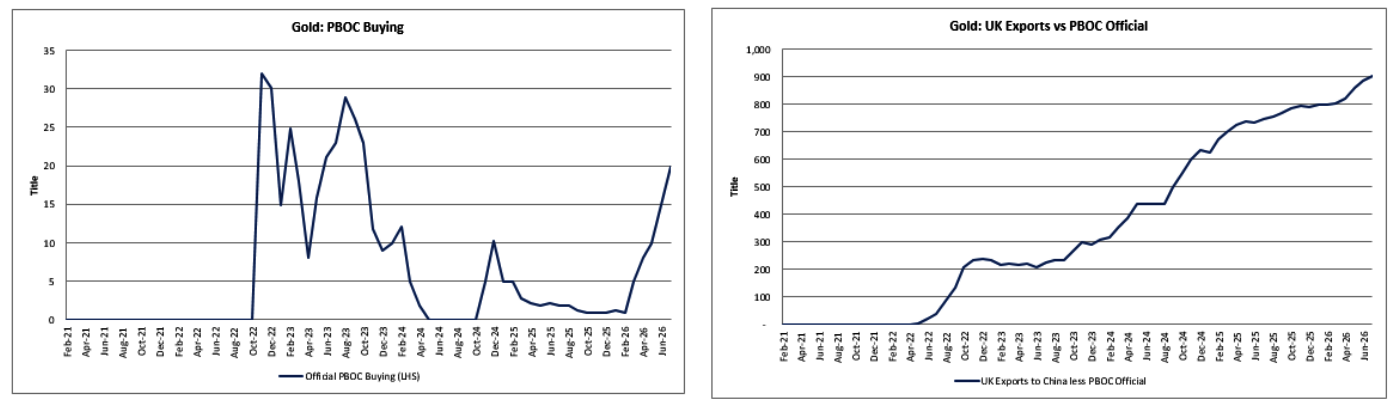
Gold Flow Update — PBOC Official Buying Reaccelerates, but China “Regular” Imports Are the Bigger Story
The latest gold flow data is constructive and reinforces the idea that gold is being supported by multiple demand channels at once:
renewed official PBOC buying,
very strong Chinese non-monetary / “regular” imports,
positive CTA momentum signals,
ongoing demand for short-dated upside structures,
and a broader macro backdrop of falling USD / lower real-yield sensitivity / policy-risk hedging.
The core takeaway:
The PBOC is back on the bid, but the bigger YTD story is that China’s non-monetary gold imports have surged far more than reported global central-bank buying has declined. That suggests Chinese private / quasi-private gold demand is now a dominant marginal flow.
1. PBOC Bought 20 MT in July
On Friday, the PBOC reported:
20 metric tons of gold buying in July
This was the largest single-month official accumulation since:
October 2023
That matters because PBOC buying had previously slowed / paused in official data, which had created questions about whether China’s official-sector demand was fading.
The July print suggests the PBOC is still structurally accumulating.
2. Possible Upward Revision Risk for June / July
The note flags an important discrepancy.
During April and May:
UK export data implied roughly 27 MT per month of buying
PBOC official data showed only roughly 9 MT per month
That gap suggests official PBOC data may understate actual buying, or that some flows are being recorded with a lag.
Simple comparison:
Period | UK Export-Implied Buying | PBOC Official Buying |
|---|---|---|
April / May | ~27 MT/month | ~9 MT/month |
The implication:
There may be upward revision risk to June / July official PBOC data, or continued divergence between customs-implied flows and official reserve reporting.
This supports the idea that China’s official-sector gold demand may be stronger than headline PBOC disclosures suggest.
3. Bigger Story: China “Regular” Imports Are Surging
The most noteworthy trend year-to-date is not just PBOC buying.
It is the scale of Chinese regular / non-monetary imports.
Comparing 1H26 vs 2H25:
Flow Category | 1H26 | 2H25 | Change |
|---|---|---|---|
China regular imports | 862 MT | 472 MT | +390 MT |
Reported global central banks | 372 MT | 434 MT | -62 MT |
This is very important.
China’s regular imports rose by 390 MT, while reported global central-bank buying declined by only 62 MT.
So the increase in Chinese non-monetary imports more than offsets the decline in reported global reserve-manager activity.
In flow terms:
+390 MT China regular imports−62 MT lower reported CB demand=+328 MT net positive swing+390 MT China regular imports−62 MT lower reported CB demand=+328 MT net positive swing
That is a large support for gold demand.
4. Bonded Flows Are Driving the Increase
The increase in Chinese regular imports is reportedly driven by stronger bonded flows.
This matters because bonded flows can reflect:
inventory build
wholesale / institutional demand
re-export dynamics
financial demand
supply-chain positioning
quasi-official or policy-sensitive demand channels
domestic premium / arbitrage-related flows
The key point is that gold demand is not only visible in official reserve data.
China-related demand is showing up across broader import channels.
5. China Ex-PBOC Demand May Be the Marginal Buyer
The note’s strongest implication is:
Even if reported central-bank demand looks less spectacular, China ex-PBOC demand has become extremely important.
This shifts the analytical focus from:
“Is the PBOC buying?”
to:
“How large is total China-linked gold demand, including non-monetary imports?”
That broader measure looks much stronger.
This also helps explain why gold can stay firm even when official central-bank buying appears to slow.
6. Franchise Flows: Still Short-Dated, Still Tactical
Franchise flows are still dominated by:
3–6 month digital-type structures
This means clients are still expressing gold upside through structured / option-like products rather than heavy long-dated outright positioning.
That has two implications.
Constructive
Short-dated upside demand can reinforce rallies if spot keeps moving higher.
Cautionary
The absence of longer-term engagement suggests not everyone is structurally committed yet.
The franchise estimate is:
5/10
So engagement is moderate, not euphoric.
7. 3M Skew Repricing Suggests Spec Activity Is Returning
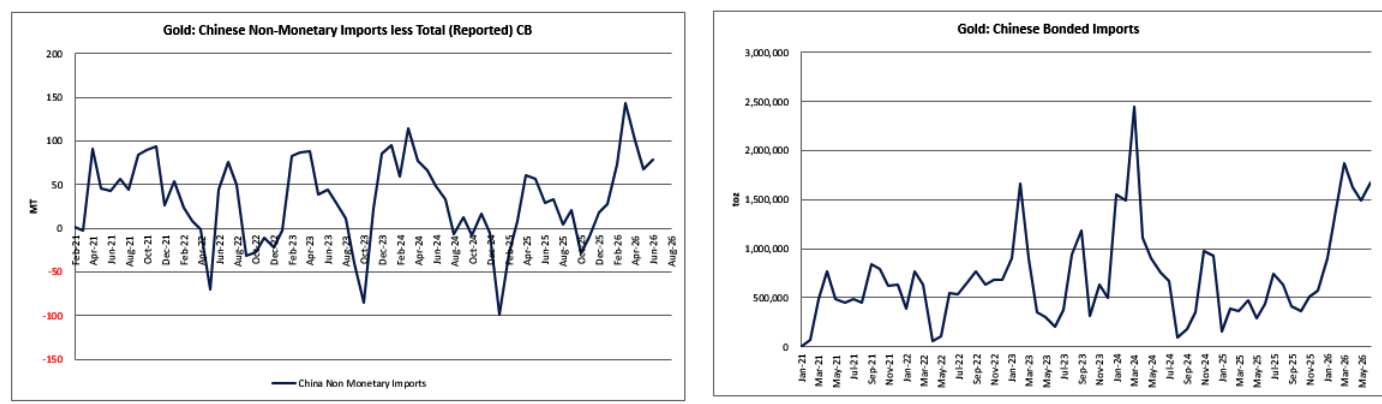
The note flags that 3-month skew has repriced.
That matters because 3M skew is often a useful barometer for speculative activity.
If upside skew is richening, it suggests:
more demand for upside calls
more speculative interest
more bullish convexity buying
possible screen-based activity rather than only franchise structures
renewed participation from macro / fast money
This fits with the recent gold rally and CTA short-covering.
8. CTA Momentum Has Flipped Positive
This is an important technical / systematic confirmation.
CTA momentum indicators have now flipped positive.
That means trend-following models are moving from:
covering shorts
toward potentially:
adding longs if the trend persists
The flow sequence is usually:
shorts get stopped out
risk-management rules force covering
momentum signals improve
systematic models turn neutral
positive trend signals create outright long demand
Gold appears to be moving through that transition.
The mechanical implication:
Gold Up→Short Covering→Momentum Flip→Potential CTA Long AdditionsGold Up→Short Covering→Momentum Flip→Potential CTA Long Additions
9. Why This Is Macro-Relevant
Gold is being supported by several overlapping themes:
USD softness
weaker payrolls
possible Fed easing repricing
real-yield sensitivity
central-bank diversification
China reserve diversification
geopolitical risk
concern around US fiscal / policy credibility
tariff / inflation risk
private Chinese demand
CTA short covering
options upside demand
This makes gold less dependent on any single catalyst.
10. Key Market Implications
Bullish Gold
The flow backdrop is improving:
PBOC bought 20 MT in July
possible underreporting / upward revision risk
China regular imports surged +390 MT
reported global central-bank buying only fell 62 MT
CTA momentum flipped positive
3M skew repricing suggests renewed spec demand
Not Yet Euphoric
However, engagement is not stretched:
franchise activity is only 5/10
longer-term engagement is not yet visible
flows still dominated by 3–6 month digital structures
This suggests there may still be room for broader participation if the rally continues.
China Demand Is the Anchor
The most important structural support is China-linked demand, especially regular imports.
11. Tactical Gold Framework
Constructive Above Recent Breakout Levels
If gold holds recent gains, CTA buying can continue and options demand may reinforce upside.
Watch Real Yields and USD
A weaker USD or falling real yields would strengthen the move.
Watch Chinese Import / Premium Data
If China regular imports stay strong, dips may remain well-supported.
Watch PBOC Monthly Prints
A continuation of official buying after July’s 20 MT would reinforce reserve-diversification demand.
Watch Skew
Further repricing in 3M skew would indicate more speculative upside demand.
The gold flow picture has improved meaningfully. The PBOC reported 20 MT of buying in July, the largest single-month official accumulation since October 2023. UK export data from April and May had already implied materially stronger buying than official PBOC figures, suggesting possible upward revision risk or underreported reserve accumulation.
But the bigger story is China ex-PBOC demand. Chinese regular imports rose to 862 MT in 1H26 from 472 MT in 2H25, a +390 MT increase, driven by bonded flows. That far exceeds the 62 MT decline in reported global central-bank buying over the same comparison period.
Meanwhile, franchise flows remain moderate and tactical, dominated by 3–6 month digital structures, but 3M skew repricing suggests speculative activity is returning. CTA momentum indicators have now flipped positive, meaning gold has moved from short-covering support toward potential systematic long demand.
In short: PBOC is back, China non-monetary imports are the bigger demand shock, and CTAs are now turning supportive.
Disclaimer: The material provided is for information purposes only and should not be considered as investment advice. The views, information, or opinions expressed in the text belong solely to the author, and not to the author’s employer, organization, committee or other group or individual or company.
Past performance is not indicative of future results.
High Risk Warning: CFDs are complex instruments and come with a high risk of losing money rapidly due to leverage. 68% and 74% of retail investor accounts lose money when trading CFDs with Tickmill UK Ltd and Tickmill Europe Ltd respectively. You should consider whether you understand how CFDs work and whether you can afford to take the high risk of losing your money.
Futures and Options: Trading futures and options on margin carries a high degree of risk and may result in losses exceeding your initial investment. These products are not suitable for all investors. Ensure you fully understand the risks and take appropriate care to manage your risk.
Patrick has been involved in the financial markets for well over a decade as a self-educated professional trader and money manager. Flitting between the roles of market commentator, analyst and mentor, Patrick has improved the technical skills and psychological stance of literally hundreds of traders – coaching them to become savvy market operators!