SP500 LDN TRADING UPDATE 23/1/26

SP500 LDN TRADING UPDATE 23/1/26
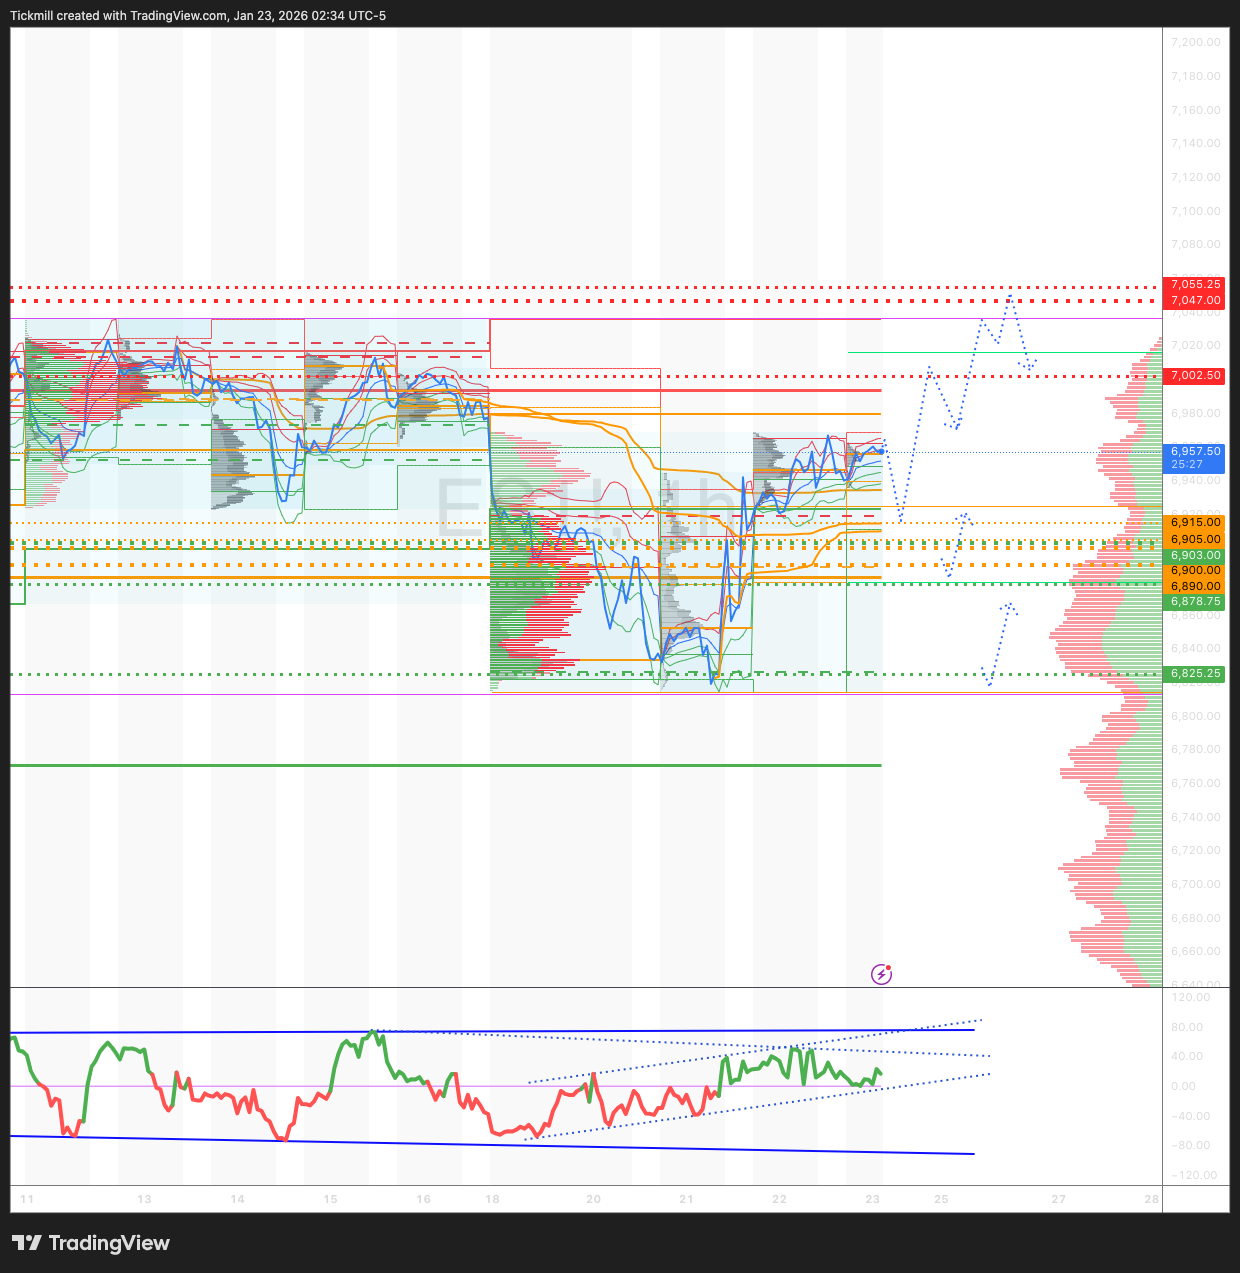
WEEKLY & DAILY LEVELS
***QUOTING ES1! FOR CASH US500 EQUIVALENT LEVELS, SUBTRACT POINT DIFFERENCE***
WEEKLY BULL BEAR ZONE 6900/6890
WEEKLY RANGE RES 7047 SUP 6903
FEB OPEX STRADDLE 6726/7154
MAR QOPEX STRADDLE 6466/7203
DEC 2026 OPEX STRADDLE 5889/7779
The area around the SPX aggregate gamma flip is at 6940. While the upside gamma is pronounced, it has somewhat smoothed since last week's vertical surface. The index has more leeway to rise. Based on the most recent analysis (Friday AH), the steep surface develops around 7030.
WEEKLY VWAP BULLISH 6969
MONTHLY VWAP BULLISH 6850
WEEKLY STRUCTURE – ONE TIME FRAMING DOWN - TBC
MONTHLY STRUCTURE – ONE TIME FRAMING HIGHER - 6775
DAILY VWAP BEARISH 6901
DAILY STRUCTURE – ONE TIME FRAMING HIGHER - 6925
DAILY BULL BEAR ZONE 6615/05
DAILY RANGE RES 7002 SUP 6890
2 SIGMA RES 7055 SUP 6825
VIX BULL BEAR ZONE 20
PUT/CALL RATIO 1.47
TRADES & TARGETS
PRIMARY PLAY - LONG ON REJECT/RECLAIM DAILY BEAR ZONE TARGET DAILY RANGE GAP FILL 6977> DAILY RANGE RES
SHORT ON REJECT/RECLAIM DAILY RANGE RES TARGET 6970
(I FADE TESTS OF 2 SIGMA LEVELS ESPECIALLY INTO THE FINAL HOUR OF THE NY CASH SESSION AS 90% OF THE TIME WHEN TESTED THE MARKET WILL CLOSE ABOVE OR BELOW THESE LEVELS)
GOLDMAN SACHS TRADING DESK VIEW - “TAME”
S&P +55bps closing @ 6,913 w/ a MOC of $1.1bn to BUY. NDX +76bps @ 25,518. R2K
+75bps @ 2,718 and Dow +63bps @ 49,384. 18.2b shares traded across all US equity
exchanges vs ytd daily avg of 18.36b shares. VIX -728bps @ 15.66, WTI Crude -
193bps @ $59.44, US 10YR unch @ 4.25%, gold +175bps @ 4,917, dxy -45bps @
98.32 and Bitcoin -98bps @ $89,290.
The mkt has quickly turned away from the risk-off tone it adopted earlier in the
week, leaning into growthier, pro-risk stocks. Russell just outperformed the S&P 500
for the 14th consecutive session, we have data back to 1981 and this is the 2nd
longest streak of outperformance in our records, trails only one time in 1996 (that
time was 16 consecutive days). Flows/index stabilized in the absence of news.
Software finally caught a bounce (IGV +160bps), we saw a notable uptick of BUY
tickets on our desk (mix of LO and HF covering) in the group and hearing a growing
view that these names have extended too far to the downside. Reminder, positioning
here at record lows.
Our floor was a 5 on a 1-10 scale in terms of overall activity levels. Our floor finished -
1% for sale vs a 30-day avg of -142bps. LO flows finished balanced (demand in
industrials and financials) while HFs skewed -$1b net sellers with broad supply across
every sector though heavily concentrated in macro, tech, and Hcare.
DERIVS: Further normalization in spot and vol markets today as the S&P roughly
closed at the implied move this morning. In vol, the front end of the curve came in
notably and skew flattened across the curve. We see this as a continuation of the
market relaxing after Tuesday's selloff. Dealer gamma is being resupplied and we
estimate dealers at long gamma at spot and will get longer to the upside. Flows wise,
we saw buyers of short-dated optionality. On the micro front, we saw a massive
amount of tech downside go through the market ahead of tech earnings. We
anticipate short gamma problems in those names off the back of this flow.
Tomorrow's straddle went out at ~50bps. (TY Gail Hafif)
POST BELL:
INTC -5% ... Q1 Revenue & Margin guidance below street at midpoint. Tough setup
given squeeze into print, likely not good enough.
COF -4.5% ... PPNR miss from higher expenses looking hot (opex and marketing) ..
One of the fears here has been 'are they going to go on a spending spree' - will look
for more on this on the call. Announced deal with Brex half stock half cash.
ISRG +2% ... Stock up post mkt with their 4Q print, with the incremental likely the
gross margin guide of 67% to 68% (bracketing cons) – probably some angst around
this line heading into this formal print. Company had already preannounced
procedures/revs and procedure guidance for ’26 already. Call at 4:30pm.
CSX +5% ... Q4 EBIT small miss $1.11bn vs. $1.2bn as expected on lower revenue
$3.51bn vs. $3.54bn. Better margins with a new operationally focused CEO at the
help likely earns credibility tonight / tomorrow
AA +4% ... 4Q Revenue of $3.45 bn vs Street at $3.29 bn. 4Q EBITDA of $546 mn vs
Street at $528 mn. Expects 2026 total alumina production of 9.7-9.9 mn metric tons
(Street at 9.98 mn) and shipments of 11.8-12.0 mn metric tons. Sees aluminum
production of 2.4-2.6 mn metric tons vs Street at 2.41 mn. 1Q guidance: $30 mn
unfavorable impact to alumina adj EBITDA and $70 mn negative impact to adjusted
EBITDA at aluminum segment. 6% implied move. Call at 5 PM ET..
Disclaimer: The material provided is for information purposes only and should not be considered as investment advice. The views, information, or opinions expressed in the text belong solely to the author, and not to the author’s employer, organization, committee or other group or individual or company.
Past performance is not indicative of future results.
High Risk Warning: CFDs are complex instruments and come with a high risk of losing money rapidly due to leverage. 69% and 73% of retail investor accounts lose money when trading CFDs with Tickmill UK Ltd and Tickmill Europe Ltd respectively. You should consider whether you understand how CFDs work and whether you can afford to take the high risk of losing your money.
Futures and Options: Trading futures and options on margin carries a high degree of risk and may result in losses exceeding your initial investment. These products are not suitable for all investors. Ensure you fully understand the risks and take appropriate care to manage your risk.
Patrick has been involved in the financial markets for well over a decade as a self-educated professional trader and money manager. Flitting between the roles of market commentator, analyst and mentor, Patrick has improved the technical skills and psychological stance of literally hundreds of traders – coaching them to become savvy market operators!