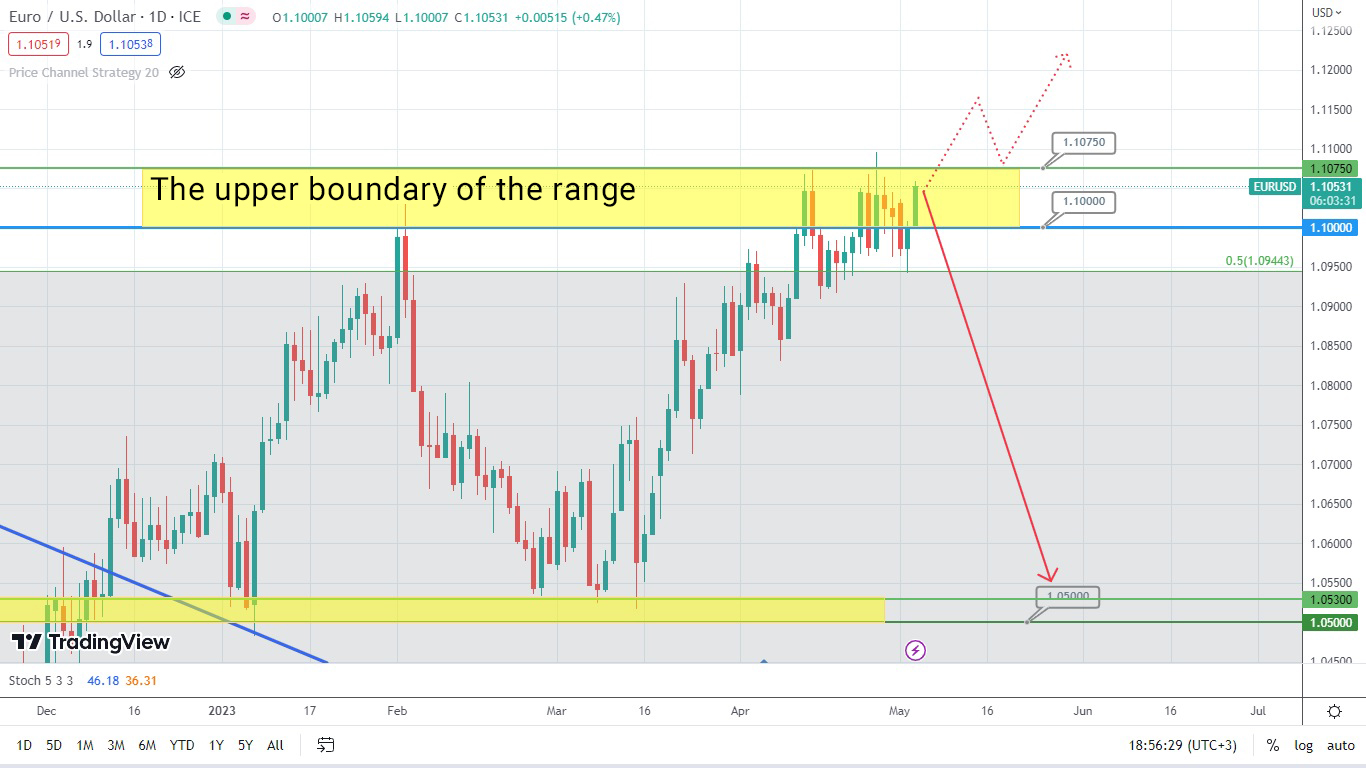
EUR/USD is at a Critical Crossroads: What’s Next?

The price of the currency pair EUR/USD keeps moving within the resistance area formed between the levels 1.1000 and 1.1075. Let’s observe when the asset price will exit this zone and make the next move.
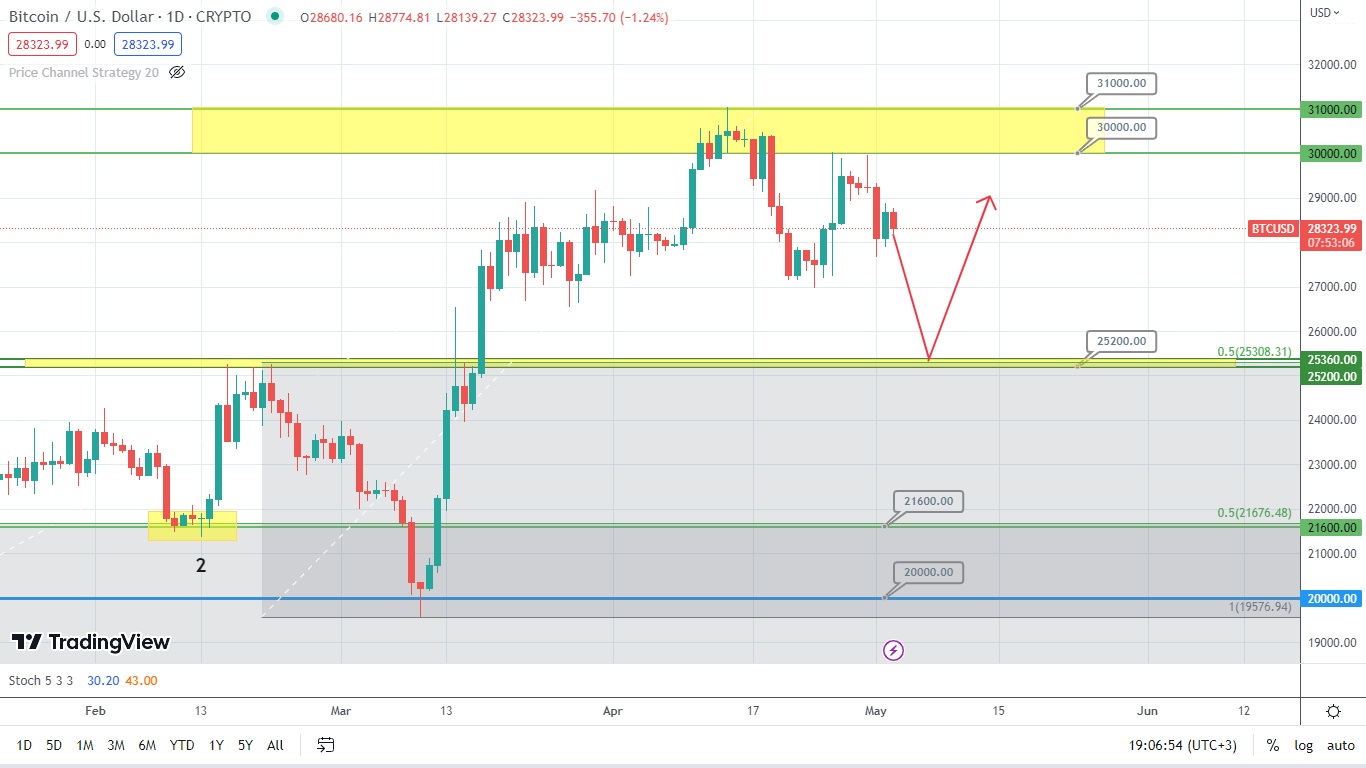
Bitcoin is undergoing correction towards the supporting level of 25200. It would be interesting to follow the price movements around this level. Although it looks like Bitcoin might potentially jump.
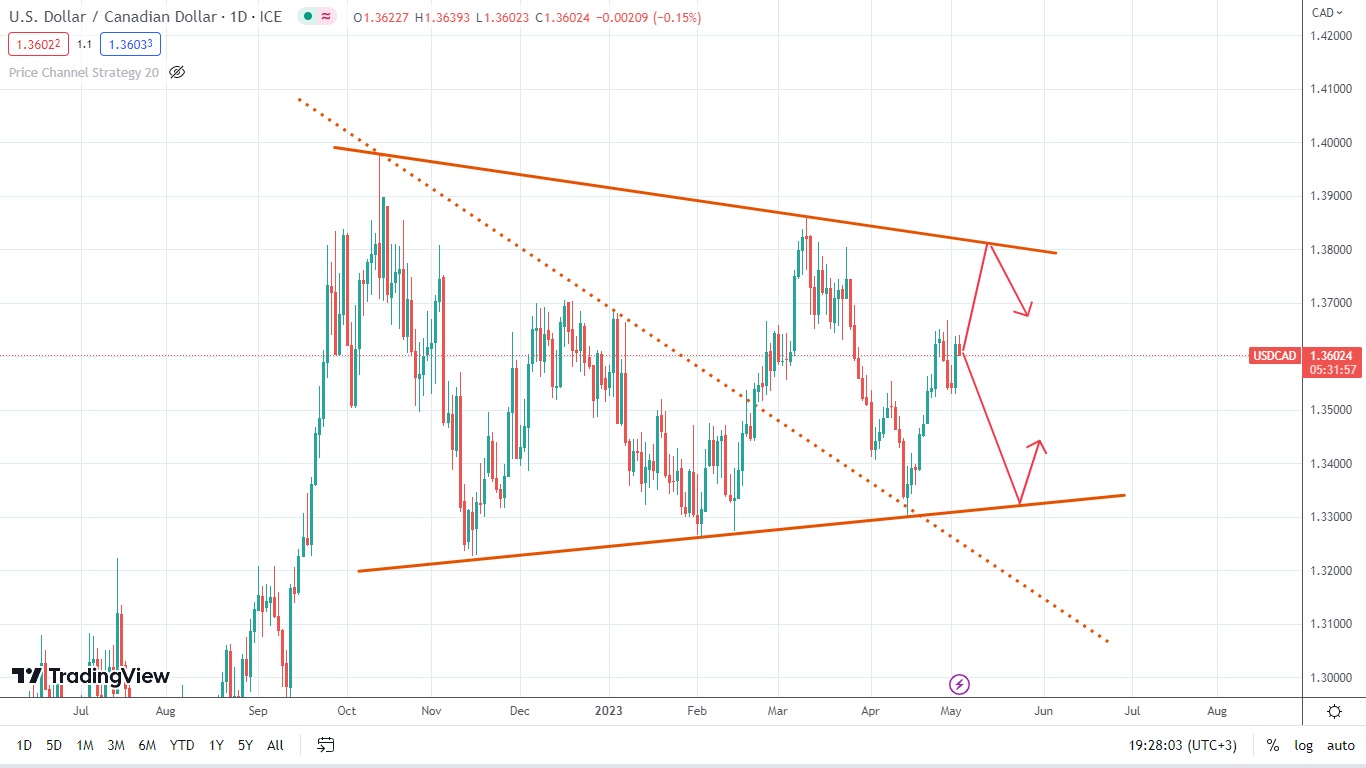
The Canadian dollar has formed a symmetrical triangle on the daily chart. Currently, the asset’s price is in the middle of this triangle. Hence, it would be wise to observe whether the asset’s price will rebound from the triangle sides inside of the pattern.
Отказ от ответственности: предоставленные материалы предназначены только для информационных целей и не должны рассматриваться как рекомендации по инвестициям. Точка зрения, информация или мнения, выраженные в тексте, принадлежат исключительно автору, а не работодателю автора, организации, комитету или другой группе, физическому лицу или компании.
Прошлые результаты не являются показателем будущих результатов.
Предупреждение о рисках: CFD-контракты – сложные инструменты, сопряженные с высокой степенью риска быстрой потери денег ввиду использования кредитного плеча. 69% и 73% розничных инвесторов теряют деньги на торговле CFD в рамках сотрудничества с Tickmill UK Ltd и Tickmill Europe Ltd соответственно. Вы должны оценить то, действительно ли Вы понимаете, как работают CFD-контракты, и сможете ли Вы взять на себя высокий риск потери своих денег.
Фьючерсы и опционы: торговля фьючерсами и опционами с маржей несет высокую степень риска и может привести к убыткам, превышающим ваши первоначальные инвестиции. Эти продукты подходят не для всех инвесторов. Убедитесь, что вы полностью понимаете риски и принимаете соответствующие меры для управления своими рисками.