S&P500 Daily Action Areas & Price Targets 26/6/26
S&P500 Daily Action Areas & Price Targets 26/6/26
***QUOTING ES1! FOR CASH US500 EQUIVALENT LEVELS, SUBTRACT POINT DIFFERENCE***
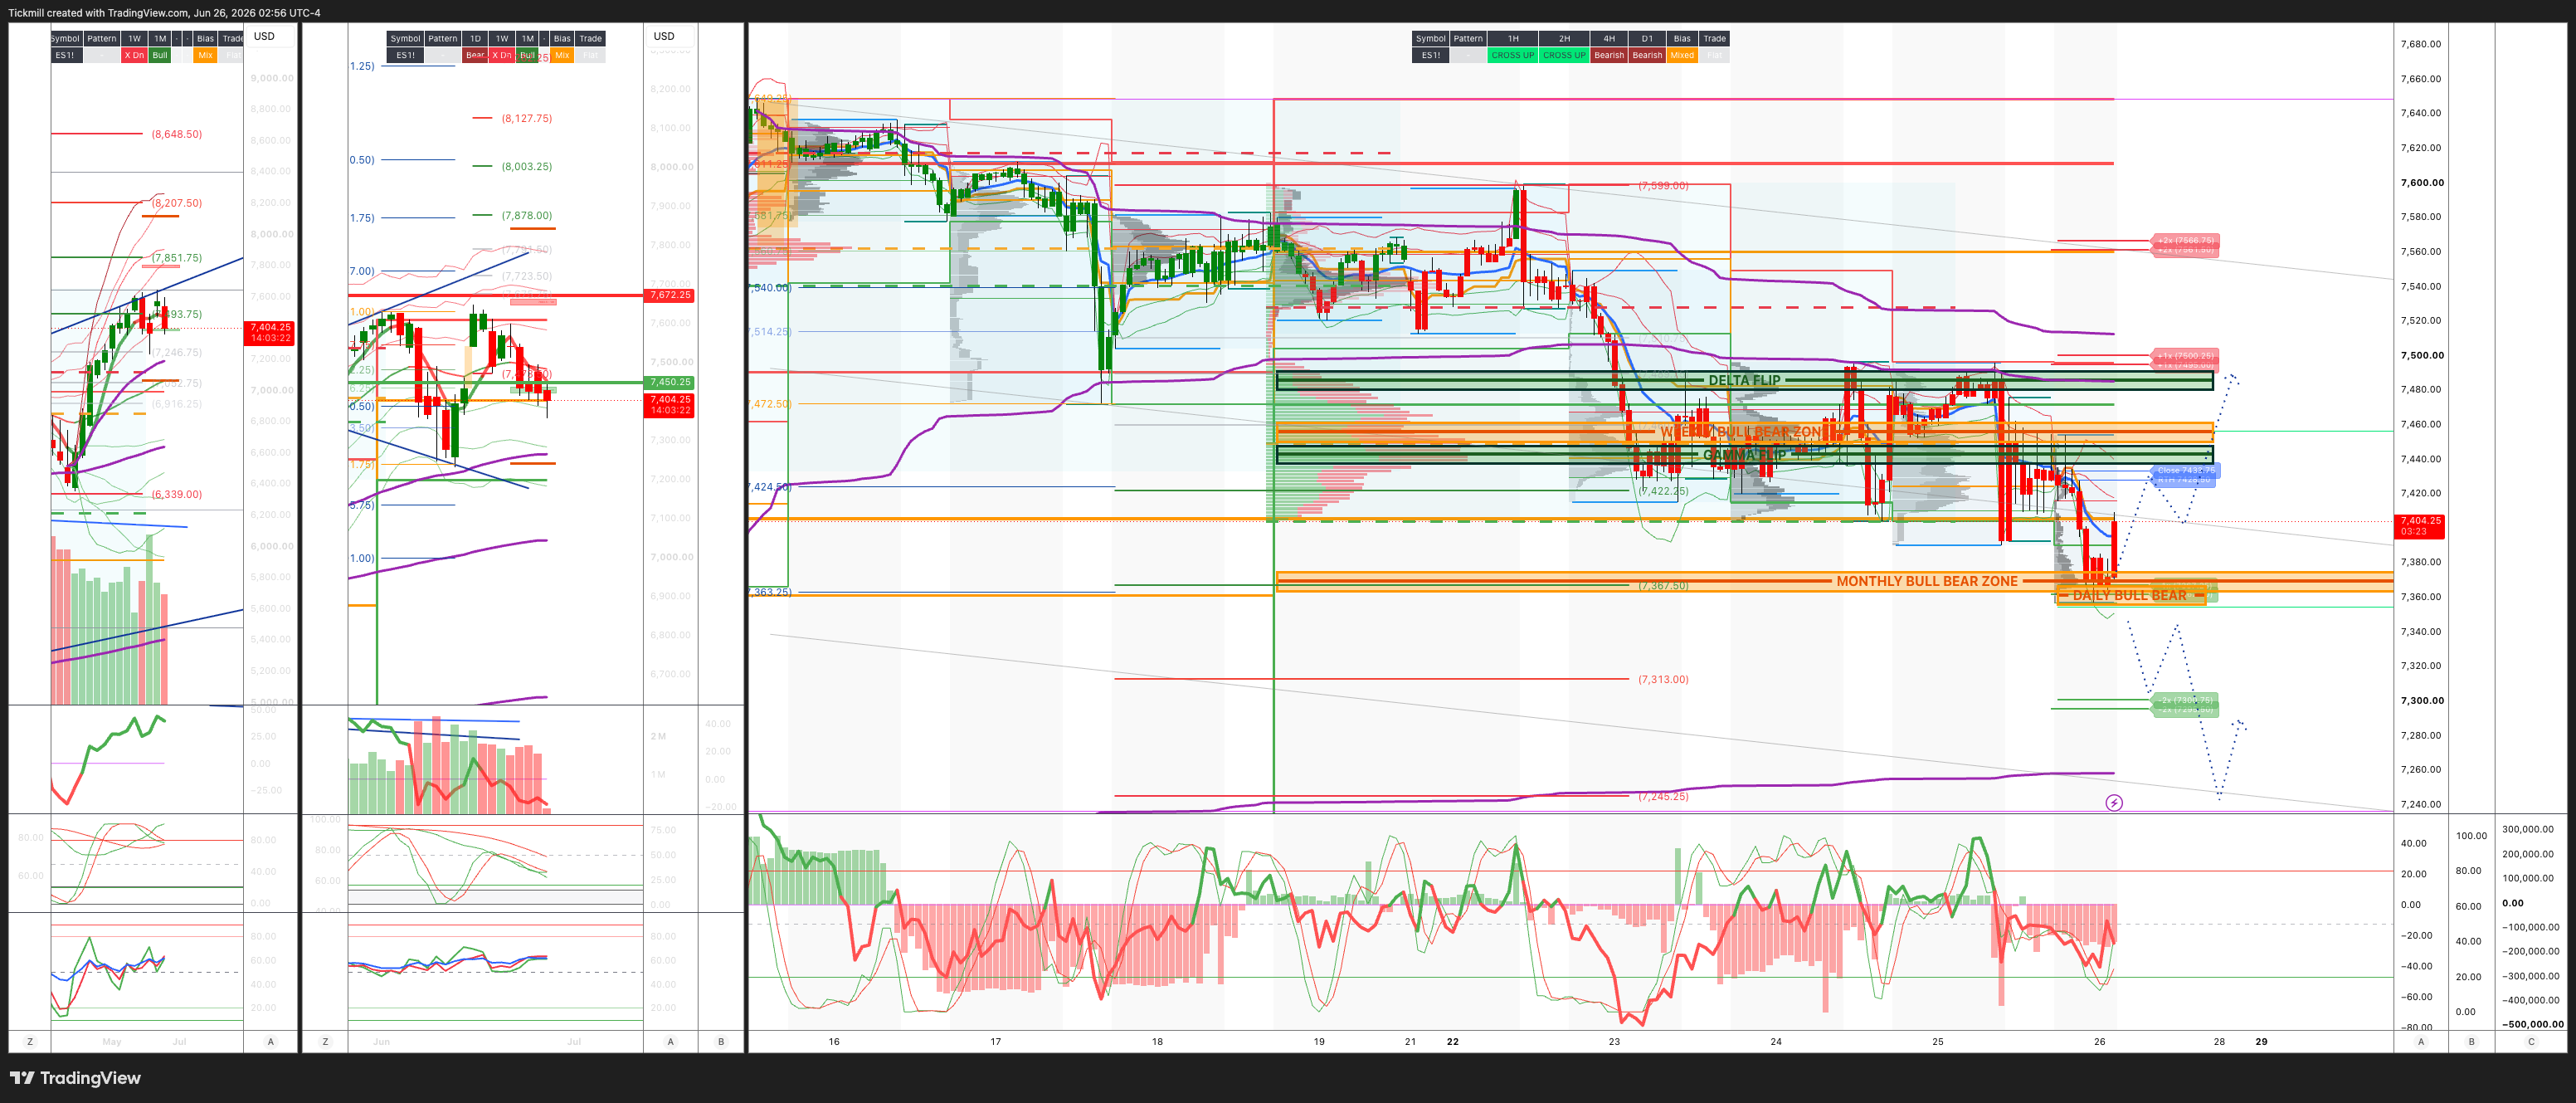
WEEKLY BULL BEAR ZONE 7560/50
WEEKLY RANGE RES 7692 SUP 7448
MONTHLY RANGE RES 7932 SUP 7384
JHEQX Q2 Collar 6189/6290 - 6865/6955
DEC2025 OPEX to DEC2026 OPEX is 945 points giving us a range of [5889,7779]
SPX PUT/CALL RATIO 1.23 (The numbers reflect options traded during the current session. A put-call ratio below 0.7 is generally considered bullish, and a put-call ratio above 1.0 is generally considered bearish)
DAILY VWAP BEARISH 7455
WEEKLY VWAP BULLISH 7494
MONTHLY VWAP BULLISH 7036
DAILY STRUCTURE - BALANCE - 7496/7390
WEEKLY STRUCTURE - BALANCE 7648/7247
MONTHLY STRUCTURE - OTFH - 7199
Balance: This refers to a market condition where prices move within a defined range, reflecting uncertainty as participants await further market-generated information. Our approach to balance includes favouring fade trades at the range extremes (highs/lows) while preparing for potential breakout scenarios if the balance shifts.
One-Time Framing Higher (OTFH): This represents a market trend where each successive bar forms a higher low, signalling a strong and consistent upward movement.
One-Time Framing Lower (OTFL): This describes a market trend where each successive bar forms a lower high, indicating a pronounced and steady downward movement.
DAILY BULL BEAR ZONE 7365/55
GAMMA FLIP 7451
DELTA FLIP 7478
DAILY RANGE RES 7501 SUP 7366
2 SIGMA RES 7570 SUP 7296
VIX BULL BEAR ZONE 17.4
TRADES & TARGETS
LONG ON REJECT/RECLAIM DAILY/MONTHLY BULL BEAR ZONE TARGET RTH CLOSE>DAILY RANGE RES
***ADDITIONAL SETUPS & TARGETS HIGHLIGHTED ON THE CHARTS***
(I FADE TESTS OF 2 SIGMA LEVELS ESPECIALLY INTO THE FINAL HOUR OF THE NY CASH SESSION AS 90% OF THE TIME WHEN TESTED THE MARKET WILL CLOSE ABOVE OR BELOW THESE LEVELS)
GOLDMAN SACHS FICC & EQUITIES TRADING DESK VIEWS
Yesterday’s tape was a much cleaner expression of the ongoing AI value-transfer trade than the headline index move suggested. The S&P was effectively flat, down 1bp to 7,357, while NDX gained 75bps to 29,440, Russell rose 62bps to 3,005, and the Dow added 14bps to 51,920. Volumes remained elevated at 20.863bn shares versus a YTD average of 19.617bn, with a modest $640mm MOC to buy. The surface-level read was stabilization after the prior AI/Semi shock, but under the hood the market continued to rotate aggressively away from mega-cap platform names and toward memory, semi-cap equipment, storage, and broader AI supply-chain beneficiaries.
The key point is that mega-cap tech remains the funding source. GSTMTMEG fell 338bps and has now underperformed SMH by roughly 18% over the last month, putting the basket on track for its worst month, around down 12%, since April 2022. That is a very meaningful internal rotation. The market is not abandoning AI; it is repricing who captures the economics. The post-MU conclusion is that more capital is being allocated to memory and upstream AI infrastructure at the expense of hyperscalers, where investors are increasingly focused on capex burden, margin drag, and monetization timelines.
The MU print strengthened the shortage/pricing story across the memory complex and extended the value transfer. SNDK rose 21%, WDC gained 5%, STX added 3%, while semi-cap and AI infrastructure names were also well bid, with LRCX up 7%, AMAT up 13%, QCOM up 4% after its analyst day, and MRVL and AMD both up around 2%. This is exactly the kind of tape that supports the thesis that the next leg of AI leadership is broader than the original megacap/hyperscaler cohort. Memory, equipment, networking, storage, custom silicon, and power-sensitive infrastructure are all attracting capital.
Macro also helped the broadening trade. Core PCE rose 0.32% in May, essentially in line with expectations, while real GDP growth was revised up by 0.5pp to 2.1% quarter-over-quarter annualized. Personal income and personal spending both rose more than expected. That is close to a soft-landing mix: inflation not meaningfully worse than expected, growth revised higher, and the consumer still spending. The 10-year yield eased back toward early-May levels at 4.3922%, which helped cyclicals and rate-sensitive pockets. The result was a clear bid to broadening beneficiaries even as megacap tech weighed on cap-weighted index performance.
The breadth was constructive. Despite the flat S&P headline, 305 S&P names finished higher, and RSP also stayed positive on the day. That matters because it confirms the rotation is not just within semis but increasingly into cyclicals, industrials, utilities, and rate-sensitive groups. The Russell gaining 62bps also supports the idea that lower yields and less inflation stress are helping smaller-cap and domestic cyclicals. The broadening theme remains intact even though the index is being obscured by mega-cap weakness.
Flows were not euphoric, which is important. The floor was a 5 out of 10 in activity and finished 148bps for sale versus a 30-day average of 19bps for sale. Asset managers were roughly flat with small supply across discretionary, tech, and healthcare, while hedge funds were around $1bn net sellers, driven by elevated short supply in industrials and communication services. In other words, the market rose internally despite modest net selling, which suggests the bid was more rotation-driven and systematic than a broad discretionary chase. The fact that hedge funds were shorting industrials while industrials/utilities still saw interest in the derivatives market adds to the sense that broadening remains under-owned and potentially painful for shorts.
Volatility behavior was also supportive. Vols were offered on the spot moves even with NDX staying green intraday, and NDX vols were little changed across the curve despite the outperformance. Skew relaxed in both NDX and SPX, most notably in SPX, which signals less urgency for broad downside protection after the prior session’s hedge demand. RUT vol and spot were little changed, while sellers of IWM vol were active throughout the day. That fits the low-vol carry regime discussed earlier: as realized volatility stabilizes, systematic and carry-oriented flows can re-engage, even if dispersion remains high inside the AI complex.
The single-stock and thematic options activity was concentrated where the market’s attention has shifted: momentum, memory, AI ETFs, industrials, and utilities. QQQ saw two-way flow as spot chopped around, which makes sense given the tug-of-war between NDX index resilience and megacap funding pressure. Thematically, the options market is confirming the equity tape: investors still want AI exposure, but they increasingly prefer upstream beneficiaries and broadening trades over the hyperscaler-heavy megacap basket.
The macro cross-asset picture was consistent with stabilization, not stress. WTI rose 247bps to $72.08, but remains well below the geopolitical-risk highs. The 10-year was essentially stable to lower at 4.3922%. DXY slipped 18bps to 101.43, gold bounced 71bps to 4,027, and VIX rose only modestly to 18.92. Bitcoin’s decline was notable, but less relevant to the equity leadership story. Overall, there was no sign of a rates shock or broad risk-off event. The day was about equity internals and AI profit-pool reallocation.
The tactical implication is that the market is still tactically bullish, but the winning expression is changing. The old trade was to own the largest AI platforms and hyperscalers as default winners. The new trade is more nuanced: own the scarce inputs, the bottlenecks, and the beneficiaries of hyperscaler capex rather than necessarily the hyperscalers funding that capex. That means memory, storage, semi-cap equipment, networking, custom silicon, utilities, power, and select industrials continue to screen well, while megacap platform names may remain sources of funds until investors get more comfort on AI monetization and capex returns.
This is also why the market can feel better than the S&P close suggests. A flat index with positive breadth, positive equal-weight, and strength in cyclicals/rate-sensitive areas is healthier than a narrow megacap-led rally. However, the risk is that a disorderly unwind in megacap tech could still pressure cap-weighted indices and trigger systematic de-risking. For now, the move appears orderly and rotational, not forced. But the elastic band between hyperscalers and upstream AI has stretched significantly, and sharp mean-reversion risk is now higher on both sides.
The implied move through the end of the week remains 0.83%. Using the S&P close of 7,357, that implies roughly 61 points of expected movement. The SPX implied range is therefore approximately 7,296 to 7,418 into week-end. With the market sitting near the lower half of the prior implied range and breadth improving, the near-term setup is constructive if vol remains offered and yields stay contained. A break below the lower end would likely indicate that mega-cap weakness is becoming index-level stress, while a push toward the upper end would confirm that broadening and AI supply-chain strength are offsetting hyperscaler pressure.
Disclaimer: The material provided is for information purposes only and should not be considered as investment advice. The views, information, or opinions expressed in the text belong solely to the author, and not to the author’s employer, organization, committee or other group or individual or company.
Past performance is not indicative of future results.
High Risk Warning: CFDs are complex instruments and come with a high risk of losing money rapidly due to leverage. 71% and 74% of retail investor accounts lose money when trading CFDs with Tickmill UK Ltd and Tickmill Europe Ltd respectively. You should consider whether you understand how CFDs work and whether you can afford to take the high risk of losing your money.
Futures and Options: Trading futures and options on margin carries a high degree of risk and may result in losses exceeding your initial investment. These products are not suitable for all investors. Ensure you fully understand the risks and take appropriate care to manage your risk.
Patrick has been involved in the financial markets for well over a decade as a self-educated professional trader and money manager. Flitting between the roles of market commentator, analyst and mentor, Patrick has improved the technical skills and psychological stance of literally hundreds of traders – coaching them to become savvy market operators!