Institutional Insights BofA Systematic Flows Monitor 11/8/26

Systematic Flows — CTA Equity Longs Return, Led by Asia; Treasury Shorts Survive NFP; Gold Short Covering Begins
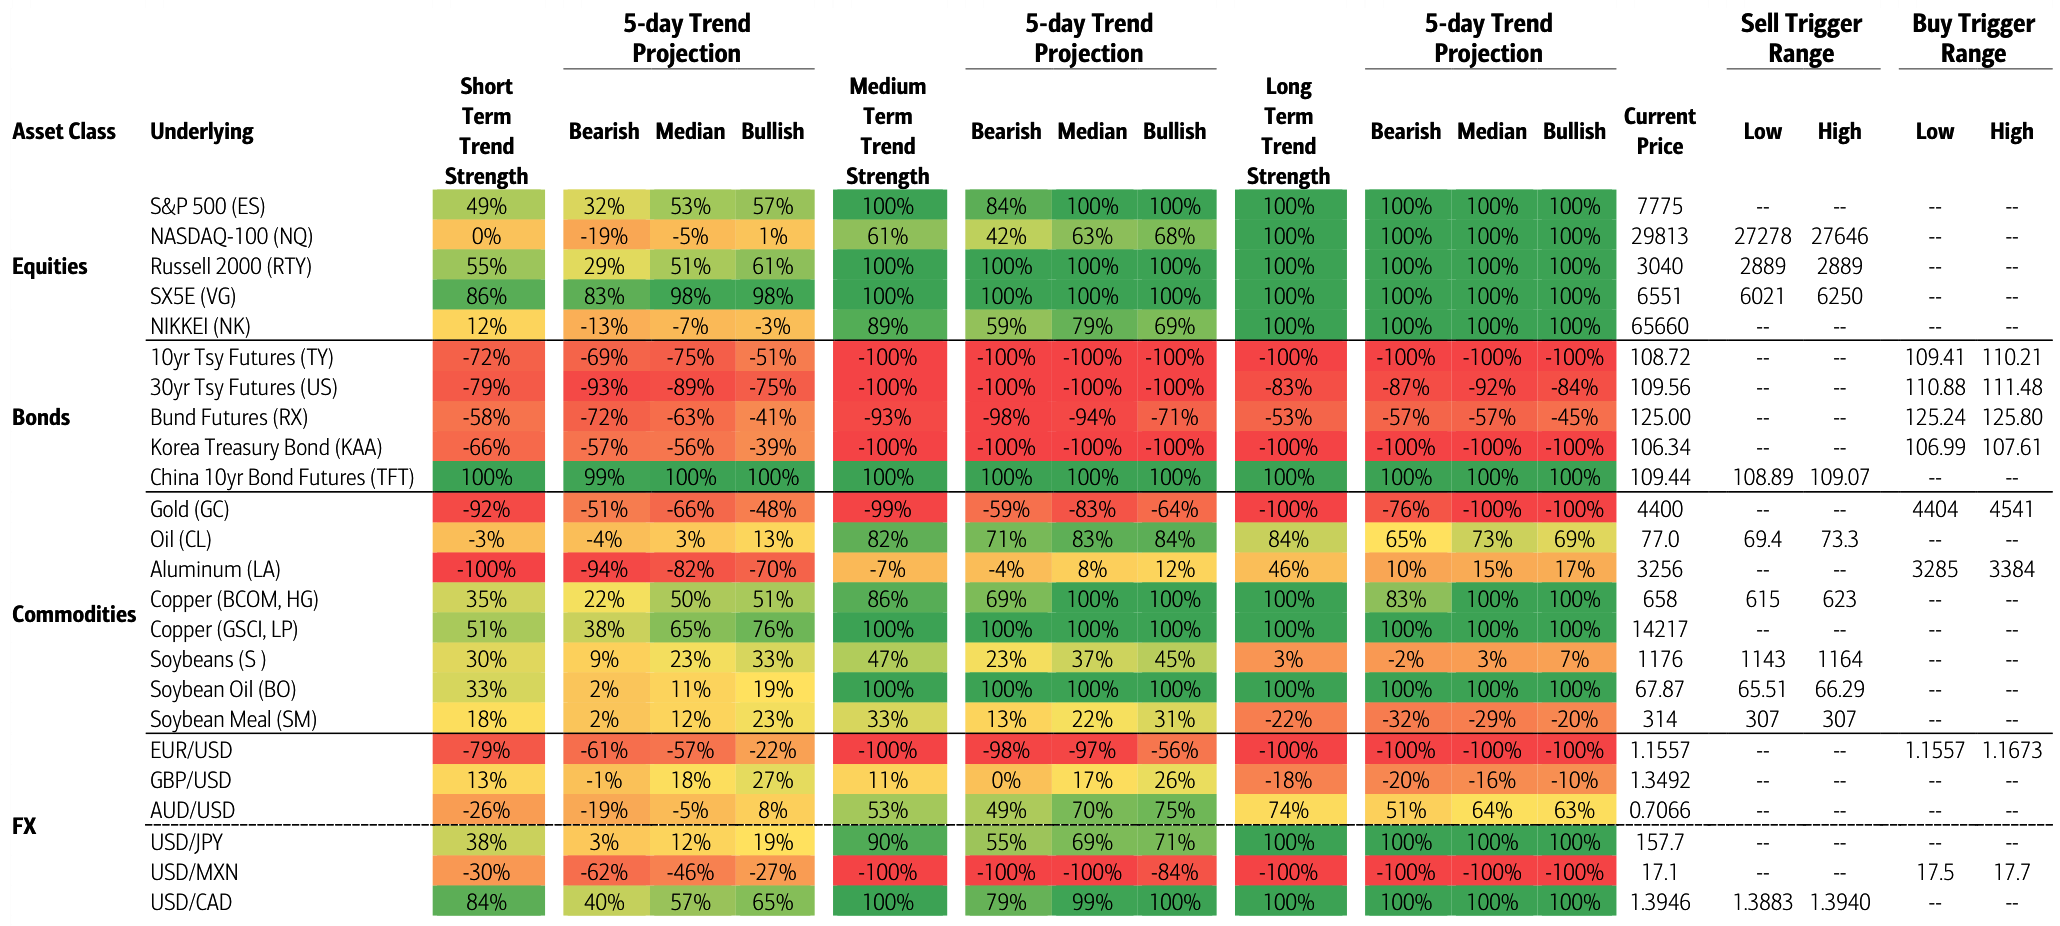
The latest positioning update shows that last week’s CTA de-risking has largely reversed in equities, especially in the Nasdaq and Asian markets. Strong global equity gains pulled trend followers back into long exposure, with buying most visible in Japan, Korea, and Taiwan. However, faster-moving CTAs remain less bullish than slower-moving models, reflecting the damage from the mid-July drawdown.
The core message:
Systematic equity flow risk has improved and is now more balanced. CTAs are rebuilding longs, particularly in Asia, while sell triggers have moved further away and would generally require declines of more than 4% to generate meaningful CTA selling.
1. CTA Equity Longs Return
Strong global equity performance appears to have reversed much of the prior week’s CTA de-risking.
The most notable rebuild happened in:
Nasdaq
Japan
Korea
Taiwan
This is important because last week’s CTA flows had been a source of downside pressure. The rebound means systematic strategies are no longer a near-term equity headwind in the same way.
Instead, they are again a marginal buyer in selected markets.
2. Asian Buying Leads
Asian equity buying was especially strong, consistent with the prior expectation that Asia could attract systematic demand.
Key markets:
Region / Index | CTA Flow Read |
|---|---|
Japan | Buying resumed |
Korea | Buying resumed |
Taiwan | Buying resumed |
Nasdaq | Medium- and long-term CTAs rebuilt longs |
US equities broadly | Longs rebuilt, but faster models still less bullish |
This aligns with the broader tactical theme of Asia ex-Japan / APAC AI catch-up, particularly Korea and Taiwan, where AI and semiconductor exposure can benefit if global AI sentiment stabilizes.
3. Fast CTAs Still Less Bullish Than Slow CTAs
Despite the rebound, there remains a split by model speed.
Faster-moving trend followers are still notably less bullish than slower-moving models across:
US equities
Nikkei
This reflects the mid-July drawdown, which damaged shorter-term trend signals more than longer-term trends.
Interpretation:
Slow models still see the broader uptrend.
Fast models remain more cautious after recent volatility.
A continued rally could force fast CTAs to catch up.
A renewed drawdown could re-trigger faster-model selling before slower models move.
This creates a more two-sided systematic flow setup.
4. Sell Triggers Are Further Away
Systematic flow risks now appear relatively balanced globally.
The most important point:
Meaningful CTA selling across tracked equity indices would generally require declines of more than 4%.
That is constructive because sell triggers are no longer close to spot.
The implication:
Sell Triggers Further Away→Lower Immediate CTA Downside RiskSell Triggers Further Away→Lower Immediate CTA Downside Risk
At the same time, in flat or up markets, buying is more focused in Asian equities.
So the flow asymmetry is:
Flat / up markets: Asian equity buying
Moderate declines: limited CTA selling
Declines greater than ~4%: meaningful CTA selling risk returns
5. Treasury Futures: CTAs Remain Short After NFP
Friday’s unexpectedly weak payrolls report initially pushed yields sharply lower, causing Treasury futures to rally.
That rally brought Treasury futures close to CTA short-covering thresholds.
But yields then rebounded from their lows, and the model indicates CTA shorts remain intact across the curve.
Key points:
CTAs remain short Treasury futures.
Front-end positioning remains closer to max short than back-end positioning.
Shorts are elevated across maturities.
NFP was not enough to force a meaningful short-covering wave.
This matters because Treasury CTA positioning remains a potential source of volatility.
If rates rally further and futures break through cover thresholds, CTAs could be forced to buy Treasuries, adding to the rally and pulling yields lower.
But for now:
Weak NFP≠CTA Treasury Short CoveringWeak NFP=CTA Treasury Short Covering
6. Rates Market Implication
Because Treasury shorts remain elevated, the next major macro catalysts matter:
CPI
PPI
Retail Sales
Jackson Hole
A soft CPI could push Treasury futures through short-covering thresholds.
That would create:
Soft CPI→Treasury Rally→CTA Short Covering→Further Yield DeclineSoft CPI→Treasury Rally→CTA Short Covering→Further Yield Decline
That would likely support:
equities
Tech / duration
gold
rate-sensitive sectors
REITs / Utilities
A hot CPI would validate CTA shorts and reinforce higher-yield pressure.
7. FX: More USD Short-Stops Triggered
The US dollar declined again this week, triggering stop-outs in some shorts against:
EUR
JPY
CAD
In practical terms, that means CTAs covered some prior USD-long / foreign-currency-short exposures.
Next week could bring additional USD selling.
Exception:
MXN
CTAs are already stretched long MXN, so the model has less scope to add further MXN exposure.
This fits a broader dollar-softening / global-risk-on setup, but the stretched MXN position is a constraint.
8. Gold: CTA Short Covering Has Begun
Gold recorded its largest weekly gain since January.
This likely triggered CTA risk-management rules after sizable short positions had developed over the prior two months.
The note suggests:
CTAs have started covering gold shorts.
Short covering could continue if gold keeps rising.
Even models that do not fully cover will likely buy because price trends are less negative and volatility is higher.
This is important because gold has already broken above recent ranges and is supported by softer real yields.
Potential flow dynamic:
Gold Price Up→CTA Short Covering→More Gold BuyingGold Price Up→CTA Short Covering→More Gold Buying
This could reinforce upside if CPI is soft or real yields continue to decline.
9. Oil: CTAs Set to Sell After Two Weeks of Declines
In commodities, the oil picture is more mixed.
CTAs that entered the week long oil are set to sell after a second week of declines.
However, oil positioning depends heavily on model speed.
This means:
faster models may already be reducing oil longs
slower models may still hold some long exposure
geopolitical headlines can reverse signals quickly
oil flow risk is less uniform than equities or gold
Given renewed US / Iran escalation headlines and WTI around US$82, oil remains highly headline-sensitive.
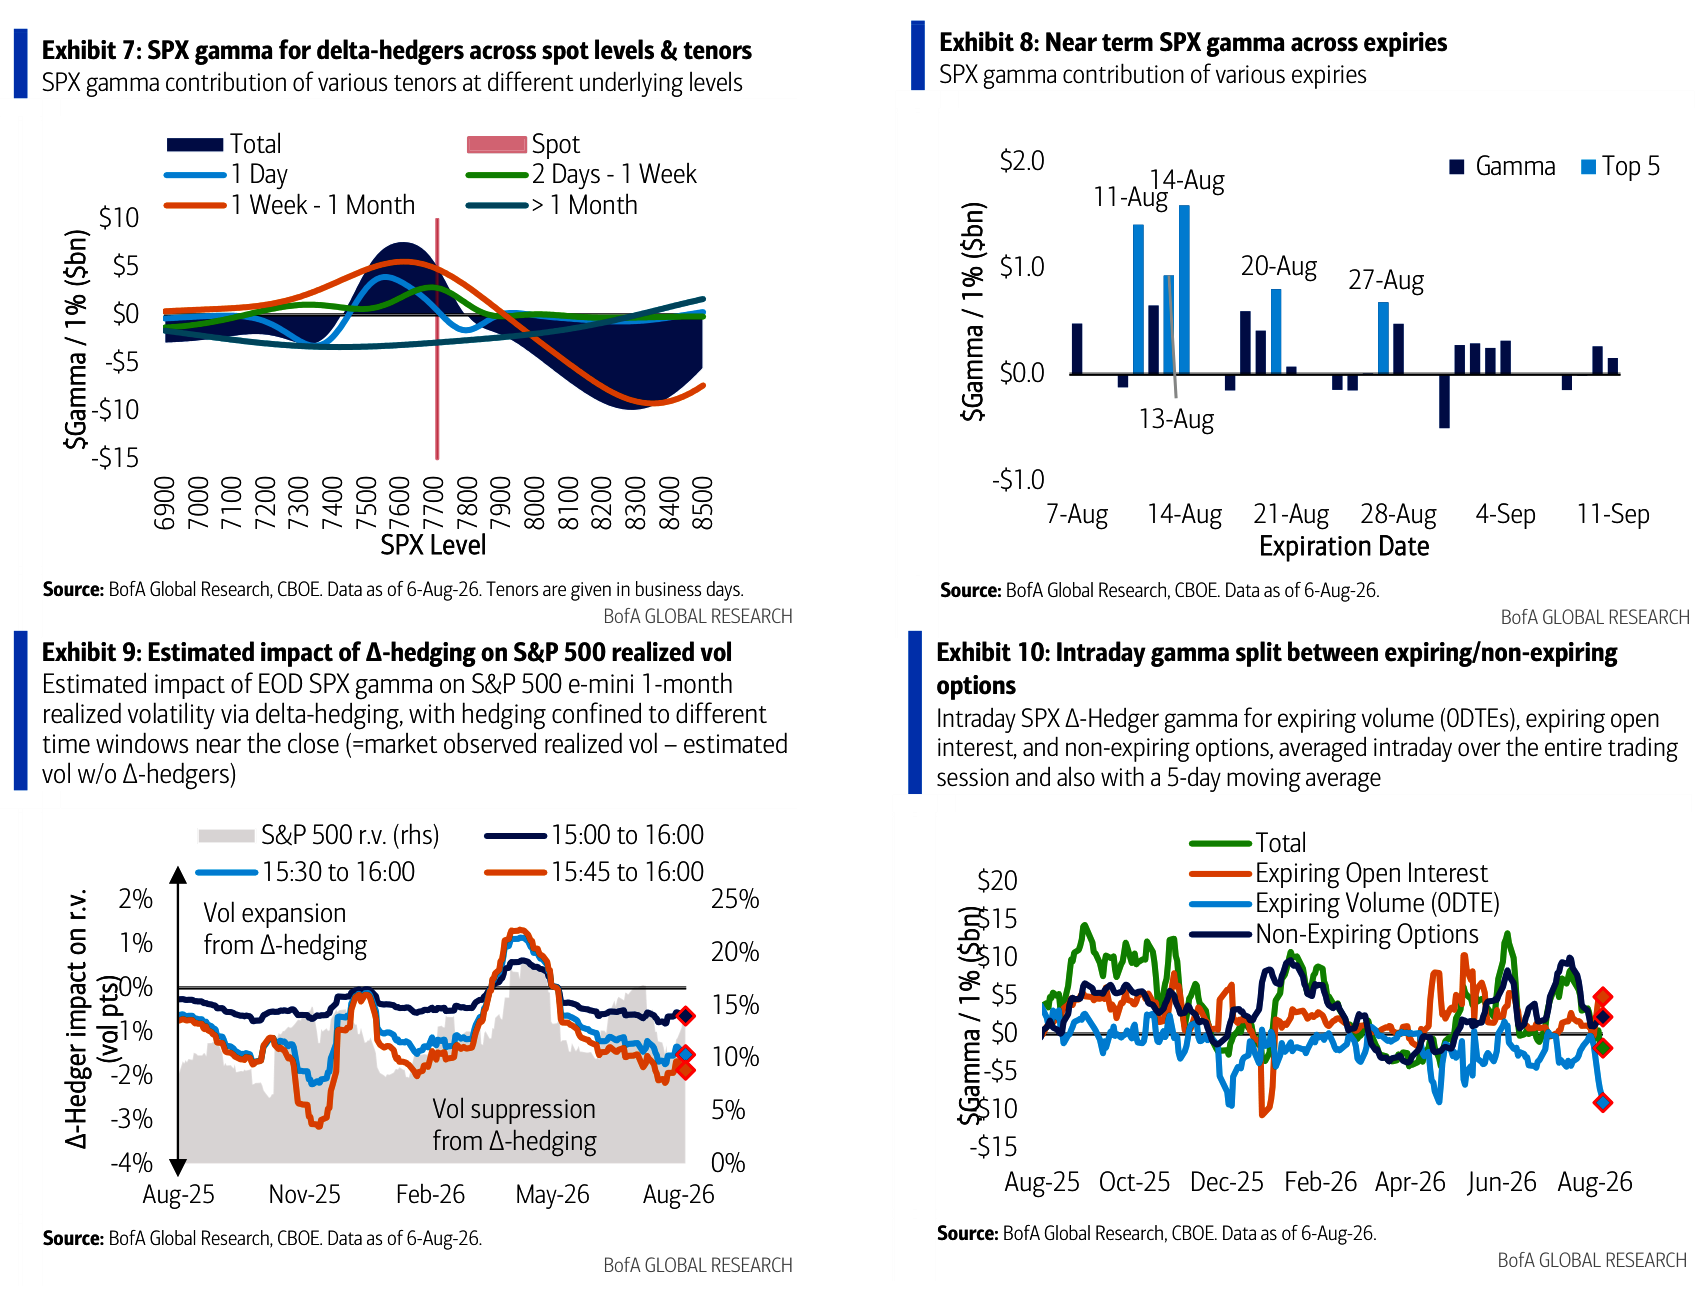
10. SPX Options: Spot Up, Vol Up Pressures Hedger Gamma
SPX hedger gamma whipsawed amid elevated volumes.
The unusual feature:
Spot rose with volatility early in the week, defying the typical negative spot-vol relationship.
Normally:
Spot Up→Vol DownSpot Up→Vol Down
But early in the week:
Spot Up+Vol UpSpot Up+Vol Up
This is often consistent with upside chase, call demand, or investors paying for convexity into a rally.
11. 0DTE Upside Demand Was Heavy
Customers net bought significant 0DTE upside.
Flows included:
Around 16k contracts in the 7650–7850 range on Tuesday
Around 35k contracts in the 7750–7850 range on Wednesday
This indicates strong short-dated upside demand into the rally.
The result is a market where dealer hedging can amplify intraday moves if spot approaches or moves through call-heavy strikes.
12. Hedger Gamma Ends Positive, But Vulnerable
Hedger gamma ended August 6 at:
US$5.1bn
59th percentile over the last year
So aggregate gamma was not extremely low or deeply negative.
However, the detail matters.
Flow later in the week net sold gamma in non-0DTE expiries, and hedger positioning as of August 6 was net short around:
22k contracts
between 7750–7900
This means if the market continues to experience:
spot up
vol up
persistent 0DTE upside demand
then hedger gamma could decline further.
That would create more potential for upside acceleration.
13. SPX Implication Near 7750–7900
The 7750–7900 zone is important because dealers / hedgers are net short contracts there.
If SPX moves into or through that zone with upside call demand persisting, dealer hedging may require buying into strength.
Potential dynamic:
SPX Rises Toward 7750–7900→Dealers Short Calls / Gamma→Dealers Buy Futures→Upside AmplificationSPX Rises Toward 7750–7900→Dealers Short Calls / Gamma→Dealers Buy Futures→Upside Amplification
But if spot fails and volatility falls, that dynamic can fade quickly.
14. Cross-Asset Flow Map
Asset | CTA / Options Flow Read | Market Implication |
|---|---|---|
US equities | Longs rebuilt, especially Nasdaq | Less immediate systematic downside |
Asian equities | Strong buying in Japan, Korea, Taiwan | Positive flow support in flat / up markets |
Nikkei | Longs rebuilt, fast CTAs still cautious | Upside catch-up possible |
Treasuries | CTAs remain short | Soft CPI could trigger covering; hot CPI validates shorts |
USD | Some USD longs stopped out | Additional USD selling possible |
MXN | CTAs already stretched long | Less room for further CTA buying |
Gold | Short covering underway | Upside flow support if rally continues |
Oil | Longs at risk of selling after declines | Model-speed dependent; headline-sensitive |
SPX options | Heavy 0DTE upside demand; hedger short zone 7750–7900 | Upside convexity possible |
15. Tactical Takeaways
1. Equity CTA Risk Is More Balanced
Last week’s de-risking has largely reversed. Sell triggers are now further away, requiring declines of more than 4%.
2. Asia Has the Cleaner Systematic Tailwind
Buying is most focused in:
Japan
Korea
Taiwan
This reinforces the Asia / APAC AI catch-up theme.
3. Treasury Shorts Are the Big Macro Flow Risk
CTAs remain short across the curve. A soft CPI could force short covering and amplify a rates rally.
4. Gold Has Positive Flow Momentum
CTA short covering has started and could continue.
5. SPX Has Upside Convexity Risk
Heavy 0DTE upside buying plus net short hedger positioning between 7750–7900 could amplify an upside move if spot rallies through that area.
Disclaimer: The material provided is for information purposes only and should not be considered as investment advice. The views, information, or opinions expressed in the text belong solely to the author, and not to the author’s employer, organization, committee or other group or individual or company.
Past performance is not indicative of future results.
High Risk Warning: CFDs are complex instruments and come with a high risk of losing money rapidly due to leverage. 68% and 74% of retail investor accounts lose money when trading CFDs with Tickmill UK Ltd and Tickmill Europe Ltd respectively. You should consider whether you understand how CFDs work and whether you can afford to take the high risk of losing your money.
Futures and Options: Trading futures and options on margin carries a high degree of risk and may result in losses exceeding your initial investment. These products are not suitable for all investors. Ensure you fully understand the risks and take appropriate care to manage your risk.
Patrick has been involved in the financial markets for well over a decade as a self-educated professional trader and money manager. Flitting between the roles of market commentator, analyst and mentor, Patrick has improved the technical skills and psychological stance of literally hundreds of traders – coaching them to become savvy market operators!